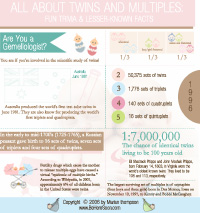
 I recently had a customer ask if I could create an infographic, based on a page she compiled full of facts and figures about multiples. Truth be told, I had to google infographic because I had no idea what it was. Of course once I googled I realized that I did know what they were, just never thought too much about them and had definitely never created one. But I like them…lots of fun ones out there!
The technical definition is a “graphic visual representation of information, data or knowledge,” but I think of them as cute, modern, pretty little graphics that help people understand facts and figures.*
The reasons for using an infographic are many. According to the Marketing Tech Blog:
 - Infographics are easily transportable
- Infographics attract a lot of attention
- Infographics remain as one of the few ways to game search engines (think backlinks when people link to your infographic)
I had fun creating the twins and multiples infographic. It was a bit different from some of the other design work I do so a bit of a break for me. After I finished I did find that there are MANY different websites that will help you create an infographic on your own. SEOMoz seemed to have a fairly comprehensive list…have fun!
*As defined in Wikipedia.